Investment Review from the Chief Investment Officer
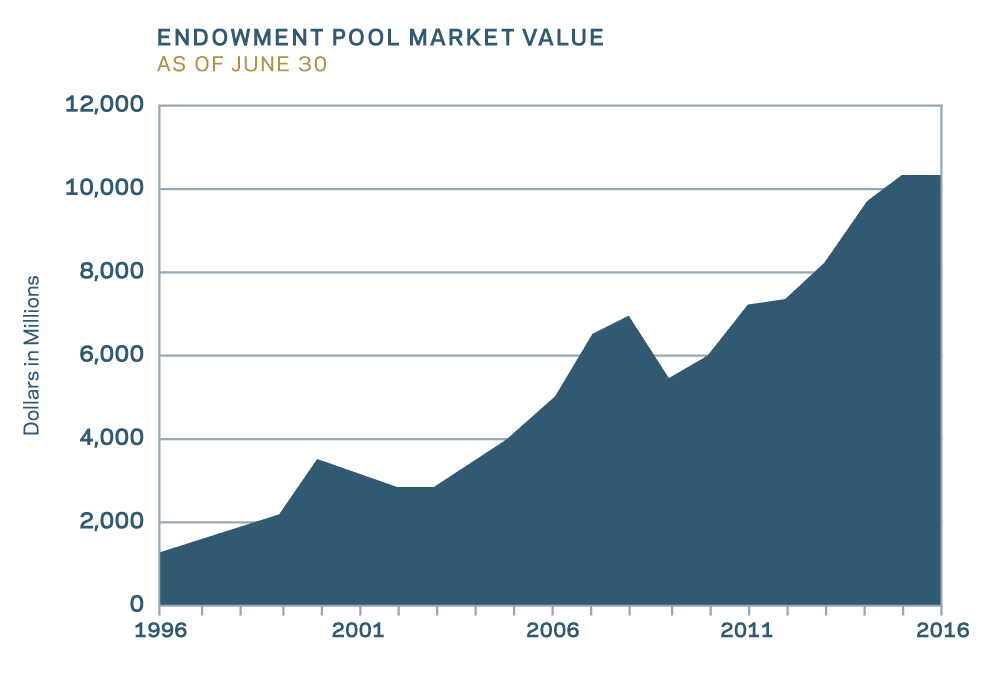
In a challenging time for global investors, the Notre Dame Endowment Pool maintained its value during fiscal year 2016 while also spending $343 million in furtherance of the mission of the University. The market value at June 30, 2016, was $10.41 billion compared to $10.45 billion at the end of the prior fiscal year.
The net investment return of (0.3) percent, when compared to the (3.9) percent return for public equity markets globally for example, highlights the benefits of our disciplined process and the quality of the University’s investment manager relationships around the world. The performance of the Endowment Pool relative to various benchmarks is shown in the chart below, which dramatically shows the difficult markets of the fiscal year but also the all-important performance of the Endowment Pool over the long-term.
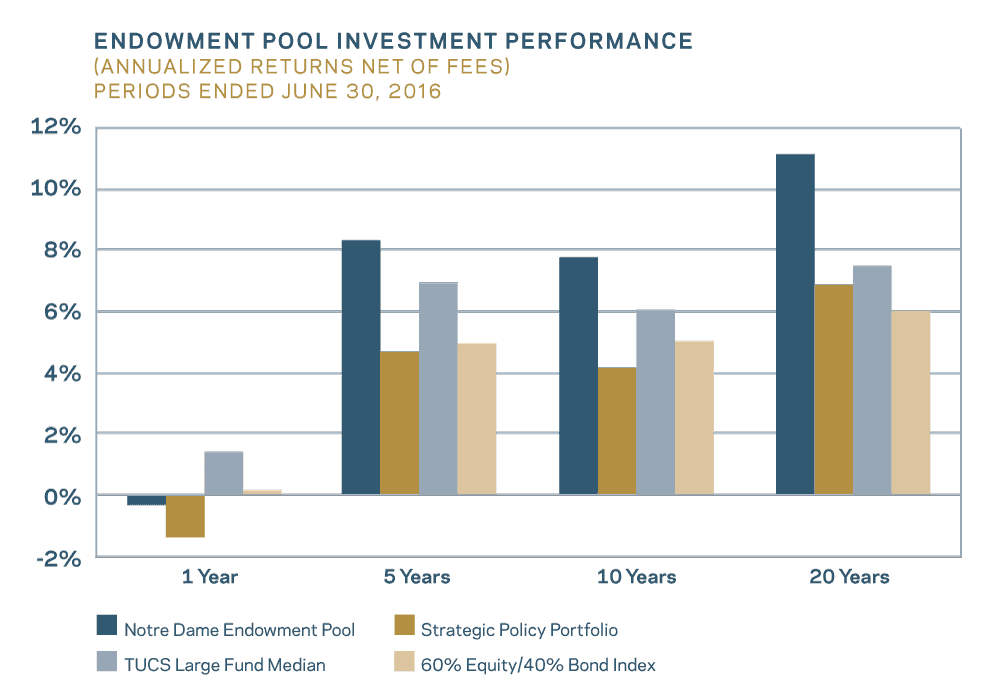 Notre Dame Endowment Pool returns are net of investment management fees. The Strategic Policy Portfolio is Notre Dame’s internal benchmark consisting of indices representative of the target investment portfolio. The Trust Universe Comparison Service (TUCS) Large Fund Median is a compilation of returns of endowment, pension and foundation investors greater than $1 billion and thus provides a basis for comparison to the performance of large institutional investors generally. The 60/40 mix is an index blend of stocks/bonds as represented by the MSCI All Country World Investable Index and the Barclays Capital U.S. Aggregate Bond Index and thus is a measure of performance compared to a more traditional or retail portfolio.
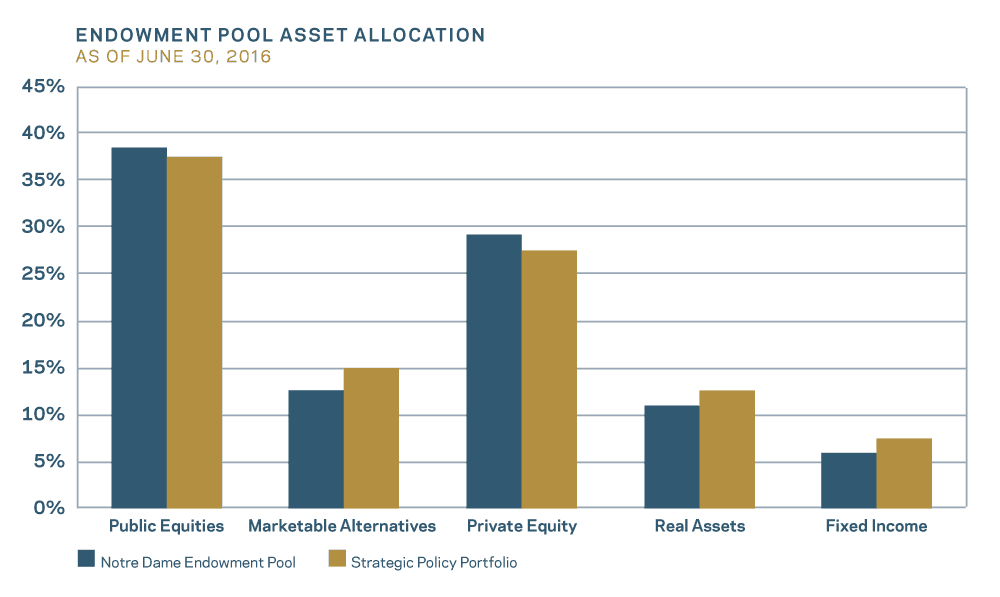
Private equity was the best performing asset class for the Endowment Pool during the fiscal year. Fixed Income also added value, and real estate provided strong returns within the Real Assets category. Public equities managers in overseas markets generally outperformed their benchmarks. Actual asset allocation compared to the Strategic Policy Portfolio targets at the end of the fiscal year is shown in the accompanying chart.
The $343 million of spending mentioned previously was an 8.3 percent increase over the prior year. The comparatively lower 3.7 percent increase in tuition evidences the importance of Endowment Pool spending, which funded 25 percent of the University’s expenditures. During the fiscal year, 32 percent of Endowment Pool spending was applied directly to student financial aid. The Endowment Pool also supports faculty chairs and numerous academic, religious and student programs, as well as the University’s general operating budget which in turn provides for additional scholarships and fellowships beyond what is supported directly by endowment. The Endowment Pool Spending chart shows annual spending for the last 20 years—cumulative spending for all purposes over that period was nearly $3.6 billion.
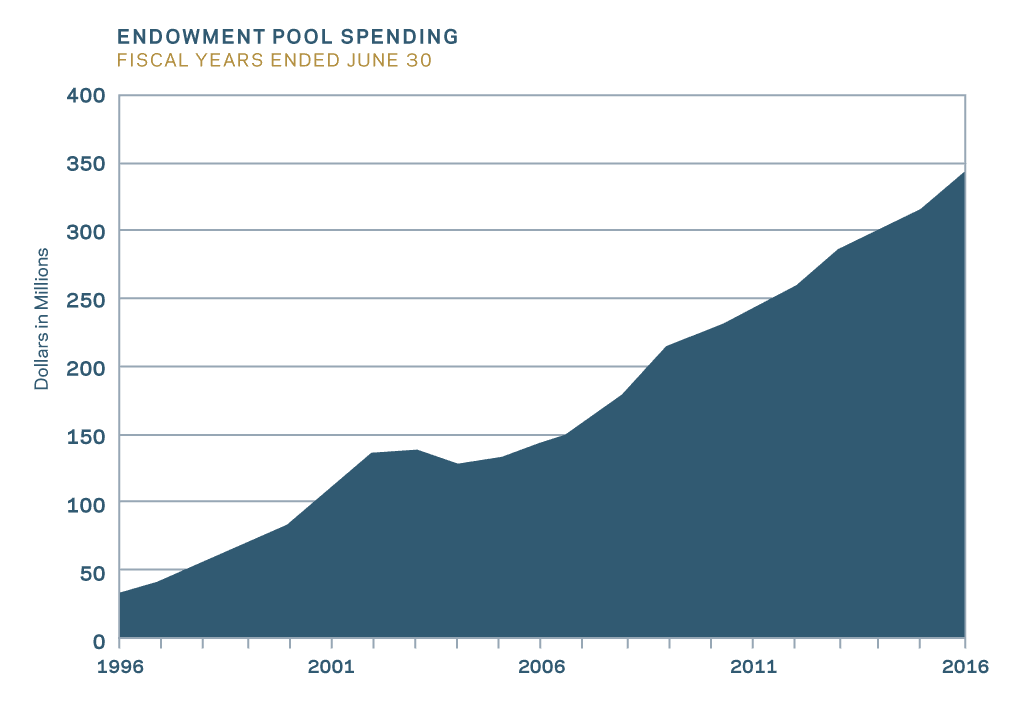
This chart also shows that a prudent spending policy, with a long-term focus, allows spending to increase in a steady fashion, thus providing budget certainty and facilitating long-term goals even when markets provide little return to investors or are unusually volatile. In investing the Endowment Pool and in benefiting by spending from the Pool, the University remains committed to its successful long-term approaches that, regardless of the conditions around us, will allow Notre Dame to continue its support of students and faculty and to thrive in every aspect of its mission.
Scott C. Malpass
Vice President and Chief Investment Officer